Authors
Jason Downing Huy Huynh JT Shepple
Overview
The general idea for our project is to mimic a 10-day weather forecast, where our program displays two type of visualizations. One of the visualizations show highs and lows with an image of the condition. The other visualization is a line graph plotting the highs, lows, and average temperature of certain cities. The project is split into several parts. The first part retrieves real weather data into several JSON files and the second part creates two different visualizations from the retrieved data.
Screenshot
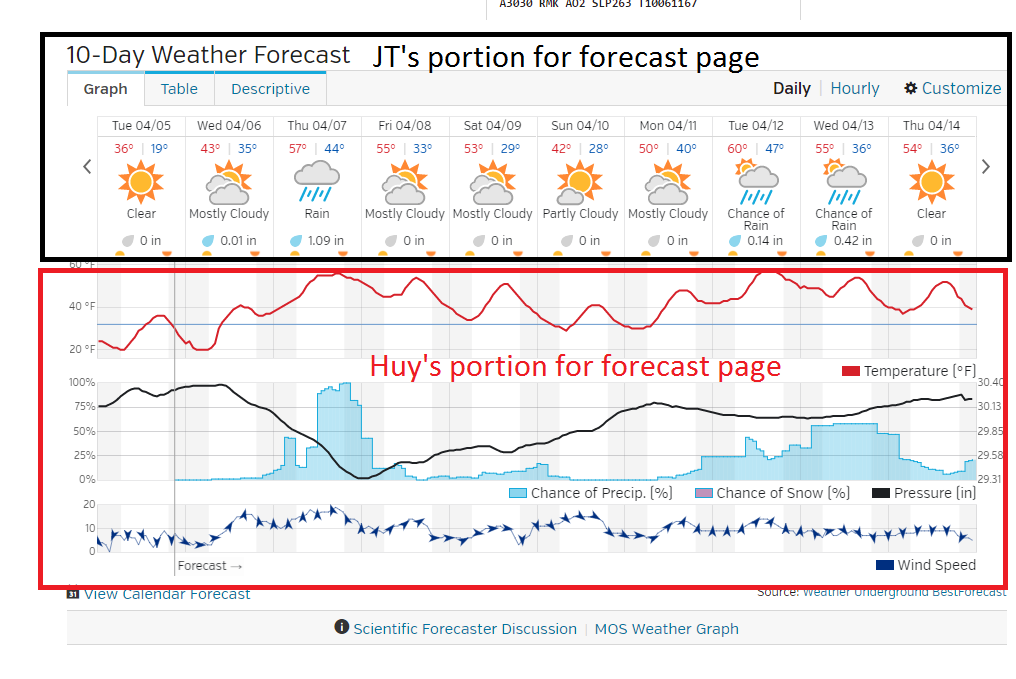
This was our initial concept and visualization of what we wanted to mimic:
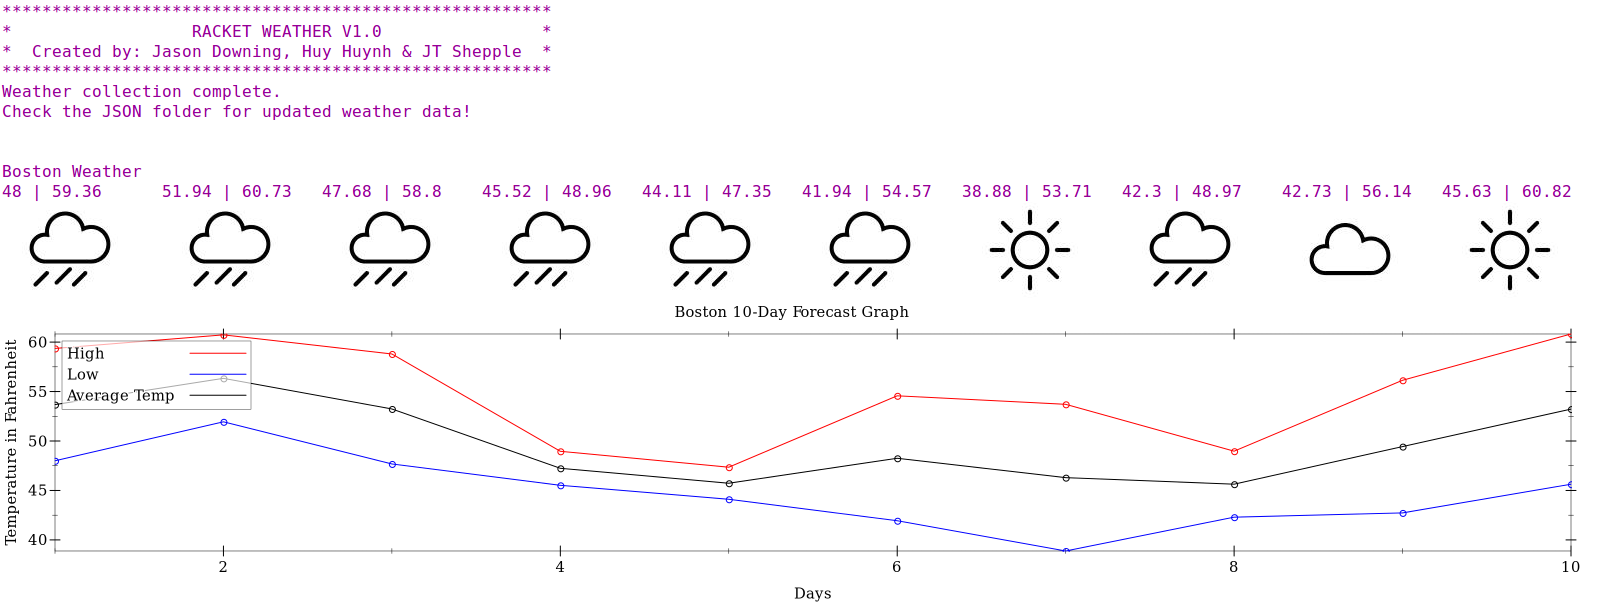
This is example output of our final program:
Concepts Demonstrated
- Data-abstraction was used with the JSON data, as we used a JSON library called "json" to manage the JSON data that was gathered from an external API.
- File I/O was used to store / open files to save and retrieve the JSON data.
- Recursion was used to grab the min, max and weather condition values from the JSON file, as well as create visualizations and gather the weather data.
External Technology and Libraries
Racket Libraries that we used include the following:
We also used one external API, the OpenWeatherMap API, to retrieve real weather data for several US cities.
Favorite Scheme Expressions
Jason Downing
This code is from a recursive procedure which goes through and grabs weather data for five cities. The code is pretty cool because I use net/url to grab the data off of the OpenWeatherMap API, and I also use 2htdp/batch-io to store the JSON data into multiple files with the cities name as the file name. This small chunk of code basically makes our entire project possible because without the JSON files that this code generates Huy and JT would have no data to use in their visualizations.
      ;; False case, get JSON data
      (begin
        (set! weather_data (string->url (car _api-strings)))
        (set! get_data (get-pure-port weather_data))
        (set! weather_response (port->string get_data))
        (close-input-port get_data)

        ;; Write to file in folder "JSON", with name as "CITY_NAME_HERE.json"
        (write-file (string-append "JSON/" (car _cities)  ".json") weather_response)

        ;; Recursive call
        (get_weather (cdr _cities) (cdr _api-strings))
      )
Huy Huynh
This is basically using the plot library and the "plot" procedure. What is interesting about this was that this plot is actually just a list and it uses a mixture of the "lines" and the "points" procedures. Having the plot as a list allowed me to overlap the "lines" and "points" procedures into one display or graph. Each of the these procedure takes in two separate lists where it has the x and y coordinates needed to plot the diagram. From there the "plot", "lines" and "points" procedure had specific traits that I was able to change such as the label name, color , the x and y labels, the dimensions of the graph, and its title. This was my favorite because I found it interesting that the procedures in the plot library were not only procedures but also contain their own objects within those procedures, which were those specific traits that I was able to change. The code itself looks simple but it was interesting to see that there were so much background work that was done. For example for changing the title I was able to use another procedure called string-append and pass it a list and a string I wanted to append. I was able to do all of this inside the "plot" procedure's specific object that it has.
      (plot (list (lines (map vector  city-x-coord list_max)
                           #:color 'red
                           #:label "High"
                           )
                    (points (map vector  city-x-coord  list_max)
                            #:color 'red
                            ))
              #:x-label "Days"
              #:y-label "Temperature in Fahrenheit"
              #:width 1250
              #:height 300
              #:title (string-append name-of-city " 10-Day Forecast Graph"))
JT Shepple
This section of code is used for iterating through the list of weather conditions in the array and deciding which photo to print out accordingly. I first tried printing the image using the bitmap/file procedure but unfortunately it kept printing out a new line so I had to find a new way. After trying a few procedures I found the print procedure was able to print the image exactly how I wanted to. I thought this was interesting because using a few other procedures, they each printed out the new line but the print funtion has more options. For this chunk of code, it recursively goes through the cond_list which is a list of the weather conditions for each of the next 10 days. It first checks for reaching the end of the the list and would print a new line, otherwise it goes through the cond expression. The cond expression checks the string to see if the weather condition string is either "Clear", "Clouds", "Rain", and "Snow" and prints out the image accordingly. The else statement is there incase the weather condition it found isn't one of the images we have.
;; Print the current citie's weather
(define (print_weather2 cond_list)
  (printf "  ")   ;Used for adding 3 spaces before the first image

  (if (null? cond_list)
      ;; End of list
      (printf "\n")     ;If it is end of the list, print a new line
      ;; Display the cond
      (begin
        (cond           ;cond procedure looking for the string of the weather condition
          ;; Clear
          ((equal? "Clear" (car cond_list))
                   (print (bitmap/file "WeatherImages/Sunny.png"))
                   (printf "\t"))
          ;; Clouds
          ((equal? "Clouds" (car cond_list))
                   (print (bitmap/file "WeatherImages/Clouds.png"))
                   (printf "\t"))
          ;; Rain
          ((equal? "Rain" (car cond_list))
                   (print (bitmap/file "WeatherImages/Rain.png"))
                   (printf "\t"))
          ;; Snow
          ((equal? "Snow" (car cond_list))
                   (print (bitmap/file "WeatherImages/Snow.png"))
                   (printf "\t"))
          (else (printf "Condition not found.\n"))
        )

        (print_weather2 (cdr cond_list))
      )
  )
)
Additional Remarks
This project is pretty cool and you should try it out! ツ We initially wanted to have one visualization with a map with pins on each of the 5 cities and have the temperature display next to those pins. However, we scratched that idea as a whole and went with imitating a 10-day forecast display that https://www.wunderground.com has on their site. We also displayed an example of what wunderground has for their 10-day forecast above. In addition, we were also able to have a driver program called racker_weather.rkt where it pulls in data from each of our racket files (similar to header and source files in C). From there the program was able to run all three of our individual programs and display the output that was shown above.
How to Download and Run
Download the latest zip, latest tarball, or git clone the repository from the following link: Racket Weather
To run, open "racket_weather.rkt" in DrRacket. It can be found the in the "Source" sub directory of the Git Repository. Once the file is open, click "Run" and the file will run "get_weather.rkt", "JT_viz.rkt", and "Huy_viz.rkt" files. The REPL will show the Visualizations that are created based on the JSON data found in the JSON sub directory of the Source directory.
Note: you will need the five libraries listed in the "External Technology and Libraries" installed. The latest version of Racket / DrRacket is also highly recommended, specifically version 6.4 as that is what our team tested our code with.
These libraries should be installed by default in the latest version of Racket (6.4), but if you run into any issues running the code, please manually install the libraries listed. net/url and json are both in the base package of Racket, but Plot, 2htdp/batch-io, and 2htdp/image are not and may need to be manually installed.